
Hubsessed Office Hours - Reporting and Dashboards - Oct 7, 2026
- Joshua OakesHost
- Madelyn DonovanHost
Wednesday, October 7, 2026
Sign in to watch the full replay and read the transcript.
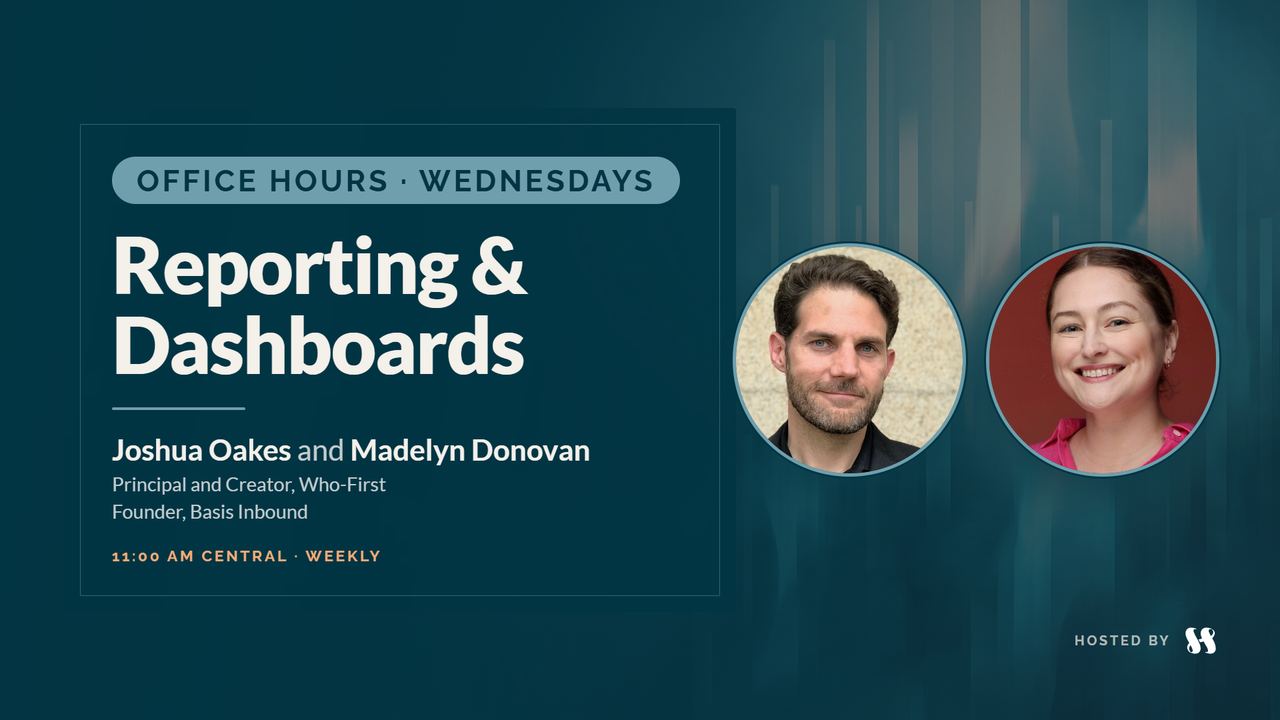
Joshua Oakes and Madelyn Donovan open the Reporting & Dashboards lane: agreeing on a report's definitions before building it, numbers versus data, color that helps people connect the dots, reports on records, the new report view on index pages, and a naming pattern for saved reports.
Clips from this session
10 short cuts from this conversation.
Portrait
7 clipsSome people don't know they're visual until they see the chartSame words, different languages, and the denominator firstAny excuse to color code a dashboardMaslow's hierarchy of reporting needsA dashboard in my back pocket, or a card on the recordReports about this record live on this recordDon't name a report for one dashboard



Key takeaways
Ask what a report is for, and agree on its definitions with the people asking, before you build it.
For any stage-to-stage report, settle the denominator first. Joshua: misleading reports are more dangerous than no data.
Numbers are not data until they match how the business really works. A table view and report view can show how often a key property is empty.
Use color on purpose, so people can connect a summary with its detail and a rep keeps one color across every report.
Reports about one record belong on that record; reports about all of your data belong on a dashboard.
The report view on index pages answers quick questions from the table's own filters and columns, without another saved report.
Name saved reports Intent - Breakdown - Timescale, with short timescale codes such as LW, TM or T90, so similar reports stay easy to tell apart.
Before you change a report, check the warning about the other dashboards it appears on.
Questions answered
Chapter times not yet verified
- 00:00Welcome to Reporting & DashboardsTopic
- 01:57The most rewarding report latelyTopic
- 06:47People don't always know what they need from a reportTopic
- 08:47Start with the denominatorTopic
- 11:38Numbers versus dataTopic
- 12:59Color that helps people connect the dotsTopic
- 17:21Maslow's hierarchy of reporting needsTopic
- 17:52Chris's question: reports versus index page viewsQuestion
- 23:58The report view on index pagesTopic
- 29:32Chris's question: naming saved reportsQuestion
- 31:13Intent, breakdown, timescaleTopic
- 36:12HubSpot's templated report names and the breakdownTopic
- 38:11A table beside the chartTopic
- 39:59When one report sits on several dashboardsTopic
- 41:35New features, goals and forecastingTopic
- 43:10Color themes and a wish listTopic
- 45:59Pattern fillsTopic
- 47:15Property colors and conditional formattingTopic
- 48:53Bring your questionsTopic
Related episodes
 Thursday, October 8, 2026, with Casey Hawkins, Chris Carolan, and Trisha MerriamAnother Orange Morning · Thursday, October 8, 2026
 Wednesday, October 7, 2026, with Casey Hawkins, Chris Carolan, and Zach HussionAnother Orange Morning · Wednesday, October 7, 2026
 Tuesday, October 6, 2026, with Casey Hawkins, Chris Carolan, and Ryan GinsbergAnother Orange Morning · Tuesday, October 6, 2026
 Monday, October 5, 2026, with Casey Hawkins, Chris Carolan, and Joshua OakesAnother Orange Morning · Monday, October 5, 2026